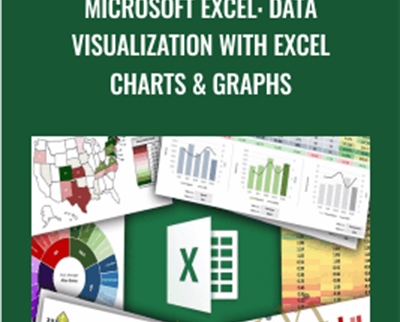
Microsoft Excel: Data Visualization with Excel Charts and Graphs – Chris Dutton
Unlock your potential with the Microsoft Excel: Data Visualization with Excel Charts and Graphs – Chris Dutton course for only $19.00 at WSOLib.com! Discover our vast library of over 60,000 downloadable digital courses across Personal Development. Get expert-guided, self-paced learning and save over 80% compared to retail prices. Transform your skills today!
Salepage link: At HERE. Archive: https://archive.is/wip/LcIYS
Ask people what comes to mind when they think of Excel, and odds are they’ll say “spreadsheets“. The truth is, Excel is an incredibly powerful, robust, and dynamic data visualization platform for those willing to think beyond rows, columns, and primitive pie charts — and I’m here to prove it.
This course gives you a deep, 100% comprehensive understanding of Excel’s latest data visualization tools and techniques. I’ll show you when, why, and how to use each chart type, introduce key data visualization best practices, and guide you through interactive, hands-on demos and exercises every step of the way.
WHAT WILL YOU LEARN?
We’ll kick things off by exploring each of the 20+ chart types that Excel 2016 has to offer, including:
- Bar & Column charts
- Histograms & Pareto charts
- Line charts & trend lines
- Area charts
- Pies & Donuts
- Scatter plots & Bubble charts
- Box & Whisker charts
- Tree Maps & Sunbursts
- Waterfall & Funnel charts
- Radar & Stock charts
- Heat maps, 3-D Surface & contour charts
- Chloropleths & Geospatial maps
- Custom combo charts & graphs
- Sparklines
- And more…
From there we’ll dive into a series of 12+ advanced Excel demos guaranteed to turn you into an absolute data viz rockstar. These aren’t “textbook” demos that you can find on YouTube; these are projects adapted from actual, award-winning work featured by Microsoft, MIT, and the New York Times. I’ve built my analytics career around data visualization, and I can help you do the same.
Whether you’re looking for a quick primer, trying to diversify your Excel skill set, or hoping to step up your data visualization game in a major way, this course is for you. In fact, if you don’t learn something brand new in this course, I will make sure you get your money back AND give you a virtual high-five for checking it out!
WHATS INCLUDED IN THE COURSE?
- Downloadable project files and resources
- Unique tips and tools that you won’t find in ANY other course, guaranteed
- Advanced demos and case studies
- Course quizzes & homework exercises
- 100% MONEY-BACK GUARANTEE
WHO SHOULD TAKE THIS COURSE?
- Anyone looking to create beautiful, custom data visualizations in Excel
- Excel users who have basic skills but want to master advanced charts, graphs & dashboards
- Students looking for an engaging, hands-on, and highly interactive approach to training
Course Curriculum
Getting Started
- Course Structure & Outline (2:03)
- Bonus Homework Exercises
Data Visualization Best Practices
- Key Principles & The 10-Second Rule (2:45)
- The Good, The Bad & The Ugly (3:44)
- Three Key Questions (1:49)
Chart Customization
- Setting Expectations (1:02)
- Chart Elements, Layouts & Styles (6:20)
- Chart Formatting Options (5:26)
- Changing Chart Types & Adding a Secondary Axis (3:03)
- Creating, Modifying & Applying Custom Templates (4:06)
- QUIZ: Chart Customization
Mastering Basic Charts & Graphs
- Bar & Column Charts (8:49)
- HOMEWORK: Bar & Column Charts
- Histogram & Pareto Charts (5:58)
- HOMEWORK: Histogram & Pareto Charts
- Line Charts & Trendlines (5:16)
- HOMEWORK: Line Charts & Trendlines
- Area Charts (4:41)
- HOMEWORK: Area Charts
- Pies, Donuts & Race Tracks (12:04)
- HOMEWORK: Pies, Donuts & Race Tracks
- Scatter Plots (7:30)
- Bubble Charts (6:36)
- HOMEWORK: Scatter Plots & Bubble Charts
- Box & Whisker Charts (6:05)
- HOMEWORK: Box & Whisker Charts
- Tree Maps & Sunbursts (6:36)
- HOMEWORK: Tree Maps & Sunbursts
- Waterfall Charts (3:17)
- Funnel Charts (3:42)
- HOMEWORK: Waterfall & Funnel Charts
- Radar Charts (7:56)
- HOMEWORK: Radar Charts
- Stock Charts (7:18)
- HOMEWORK: Stock Charts
- Heat Maps (4:41)
- HOMEWORK: Heat Maps
- Surface & Contour Charts (7:35)
- HOMEWORK: Surface & Contour Charts
- Geospatial Maps with Power Map (5:28)
- HOMEWORK: Power Map
- Basic Combo Charts (7:57)
- HOMEWORK: Combo Charts
- Sparklines (2:07)
- HOMEWORK: Sparklinest
- QUIZ: Basic Charts & Graphs
Next-Level Data Viz Demos
- Setting Expectations (1:40)
- DEMO: Custom Image Overlay Charts (6:01)
- DEMO: Adding Binary Values to Highlight Ranges (5:02)
- DEMO: Automation with OFFSET & COUNTA (7:08)
- DEMO: Adding Interactive Elements with Form Controls (12:30)
- DEMO: Animating Changes Over Time (14:20)
- DEMO: Building a Dynamic Dashboard (Part 1) (16:10)
- DEMO: Building a Dynamic Dashboard (Part 2) (12:08)
- DEMO: Dynamic Value-Based Formatting (10:09)
- DEMO: Dynamically Highlighting a Data Series (10:26)
- DEMO: Building a Custom Pacing Chart (10:22)
- DEMO: Building a Custom Gauge Chart (9:58)
- DEMO: Visualizing Percentages with Arrays (7:16)
- QUIZ: Next-Level Data Viz
Wrapping Up
- Resources & Next Steps (2:38)
Secure your future with the Microsoft Excel: Data Visualization with Excel Charts and Graphs – Chris Dutton course at WSOLib.com! Gain lifetime access to expertly curated content, empowering your career and personal development.
- Lifetime Access: Enjoy unlimited access to your digital courses.
- Huge Savings: Prices are consistently up to 80% lower than original sales pages.
- Secure Transactions: Shop with confidence using our trusted payment methods.
- Actionable Knowledge: Acquire real-world skills from diverse topics.
- Instant Delivery: Start learning immediately after purchase.
- Device Flexibility: Access your courses on desktop, mobile, or tablet.
Begin your learning journey with WSOLib.com!
Specification: Microsoft Excel: Data Visualization with Excel Charts and Graphs – Chris Dutton
|
User Reviews
Only logged in customers who have purchased this product may leave a review.


$19.00


There are no reviews yet.